Xero Financial Reporting in Looker using G-Accon for Xero, BigQuery and dbt
We use Xero as our accounting package at Rittman Analytics and thought it’d be useful to bring in some of our key financial and performance metrics from Xero’s Profit and Loss report (Income Statement for our US readers) into our Looker environment, so that we can monitor gross and net revenue trends over time, check expenses and staff costs are within budget and keep an eye on our most important financial KPI, Net Margin %.
Although Xero is a supported data source for Stitch, Fivetran and most other data pipelines-as-a-service, trying to reconstruct a P&L report from all of the Xero API tables whilst applying manual journals, categorising accounts into revenue or costs and coming-up with the same numbers as Xero’s own reports is fairly tricky; another approach that we’ve used with success is to use a Google Sheets add-in such as G-Accon for Xero to schedule exports of Xero’s P&L report into a Google Sheet and then access the results using a Google BigQuery external table.

g-accon.png
When you’ve set the Xero report export up within Google Sheets and G-Accon for Xero, the next step is to setup a federated table in Google BigQuery that maps to the Google Sheets sheet that you’ve just setup. Remember to share the Google Sheets file with the GCP service account that your Looker connection uses when accessing Google BigQuery data otherwise you’ll get a permissions issue when trying to query the Sheets data from Looker.

bq.png
Our next step was then to use dbt (“Data Build Tool”) to transform Xero’s account-level P&L numbers as landed into our base BigQuery federated tables into aggregated and derived revenue, cost of sales and overheads KPIs along with net and gross profit, margins and so on.

dbt.png
Now our financial numbers and P&L account details are in Looker as additional views within our main operational analytics LookML model we can start by reproducing the original Profit & Loss report using Looker’s new beta-release Table-Next visualization, giving us subtotals for the account categories as you’d normally expect to see in a P&L-style financial report (numbers obfuscated, in-case you were wondering).
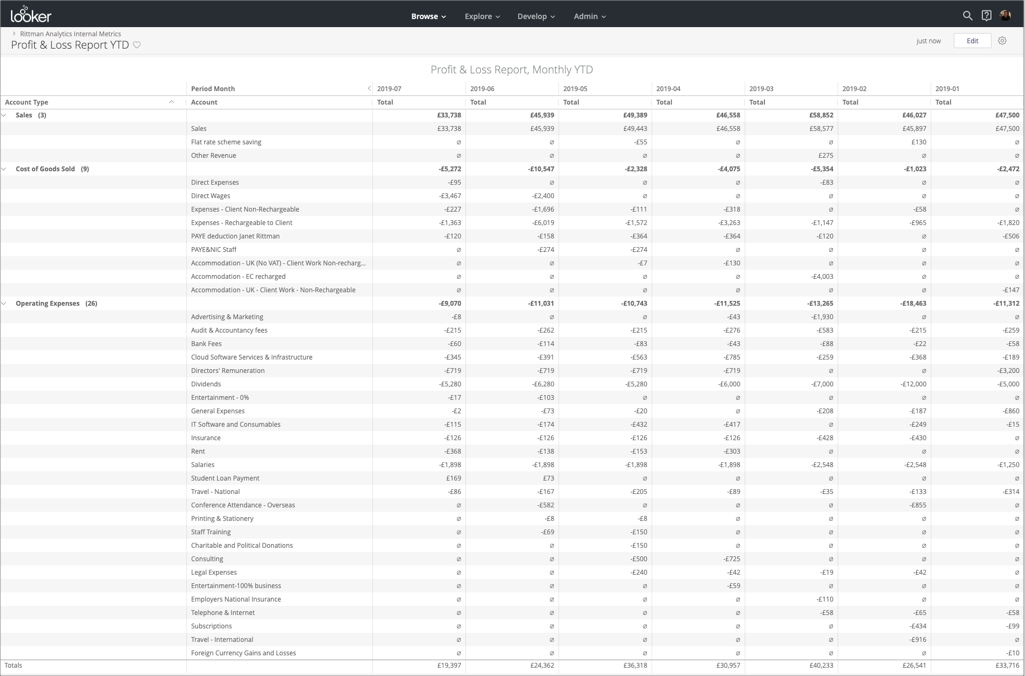
pandl.png
Then to accompany the detail-level P&L report we then created a financial performance dashboard, some of the contents coming from the derived and aggregated financial KPIs table we created beforehand in dbt, some of the numbers (discretionary expense tracking over time for example) coming from the base P&L report numbers. Note how we’ve used Looker’s recently-added trellis charting feature to break expenses spending out by the discretionary spend categories we’re most interested in, I think this works well for this type of analysis.

dashboard.png
Whether you go down the path of full Xero data integration into your warehouse using a service such as Stitch or Fivetran or if you choose the report-based export approach we used here, really comes down to whether you need granular access to every bit of your accounting data or some high-level (and processed) numbers as we did in this particular example.
We’ve done both on projects for customers and ourselves in the past, so if you’re interested in bringing in Xero or other financial accounting data into your Looker analytics platform, send us an email or call our office on +44 1273 234690 and we’ll be happy to talk through the various options with you.